Measure League of Legends Performance with this Game Grade
Have you ever wanted a way to quantify how well you play in League of Legends?
The League of Legends grade system works quite well, but also feels like it lacked a bit of resolution and has unexpected grades at times. Some third-party stats tools also provide an overall grade, but these seem to range from ‘questionable’ to downright illogical.
At MaddCog we were looking for a way to quantify overall game performance, so we could see the impact that mental performance has on how well you play. So, with this goal, we set about establishing our own League of Legends game grade.

What is performance?
If our game grade is a way of measuring player performance, then the obvious question is ‘what is performance?’ This is a difficult question in a team game like League. Is it kills, structures destroyed, dragons, or is it more strategic?
We decided to have no opinion on what actions were good or bad, but rather focus on the outcome. The aim of playing is to win, so we wanted to develop a grading model that represented the impact the player had on winning the game.

To achieve this, we needed to develop a model based on available game statistics. This can be limiting as statistics do not directly consider strategic aspects of the game. You may do something in-game that has a meaningful impact on game outcome, but it cannot be measured via game statistics. Despite this, the majority of performance can be measured in these stats, they are easily available, and they are a clean way to objectively assess each game.
What is the game grade?
We looked at over 41,000 individual games of League of Legends, with a spread across all ranks. For each player, we reviewed the champion used, lane, rank, game outcome and a wide range of game statistics for that player.
The first thing we found was that game stats needed to be duration dependent. So, we divided each stat by duration in minutes.
While we started out with a large number of game stats, we found that many offered no real benefit in improving our game grade. So, we settled on a model with only 5 statistics:
- Deaths per min — total deaths / game duration in minutes
- K_A per min — (kills + assists) / game duration in minutes
- Level per min — champion level / game duration in minutes
- TD per min — total damage / game duration in minutes
- Gold per min — gold / game duration in minutes
I have left some of the statistical details to the end of this article, but the equation we ended up with was:
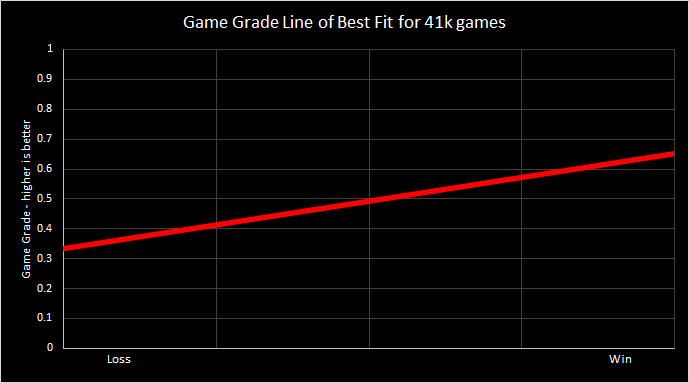
Game Grade = 0.336 — (1.437 x Deaths per min) + (0.000117 x gold per min) + (0.443 x K_A per min) + (0.264 x Level per min) + (0.000013 x TD per min)
A game grade closer to 1 means the player had a ‘winning’ performance, while a grade closer to 0 equated to a ‘losing performance’.
To determine which stats are most important, we look at the standardised coefficient of each, where a higher value indicates it has a larger impact on player performance:
- Deaths per min: -0.241
- K_A per min: 0.194
- Level per min: 0.043
- TD per min: 0.026
- Gold per min: 0.023
This shows that the stats that have the most impact on game performance are (not surprisingly) deaths, kills and assists. However, an important outcome here is that getting a kill isn’t worth dying for.
The common question when looking at this list of variables is ‘what about creep score?’. While important, the value of creep is getting gold and gaining levels. Therefore, creep itself is a means to achieving these, and the model already includes level and gold.
Accuracy
Assessing accuracy of a game grade model objectively is difficult. We decided to use the accuracy with which the model predicted the win or loss. The grade of an individual player was 78.3% accurate in predicting game outcome. That is, grades above 0.5 equated to a win, and grades below 0.5 equated to a loss in 78.3% of games.
Overall, we felt this was pretty good given this is a team game where a player could have a great game on a losing team, or a poor performance could be dragged to a win by a strong team.
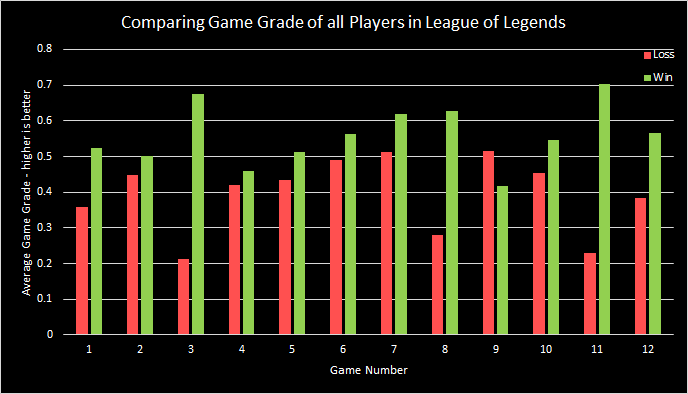
If we combine the game grades of all players in each team, we would expect the accuracy to be even higher. We did this on a random selection of 12 games where we looked at all ten players and found that the winning team had a higher average grade on eleven of these occasions (92%). The single inaccurate game occurred where two players on the winning team carried the team to a win.
The other aspect of accuracy is more difficult to quantify; that is how the grade feels to the user. The feedback from our testing is that it feels ‘right’ the majority of the time. This is what we would expect. There are occasions where a statistical model misses important strategic aspects of the game, but overall, it is a suitable means of monitoring League of Legend player performance.
Surprising Findings
When we started this project, we thought there would need to be a different model for different lanes, and different ranked players. But we were surprised to find that the differences in these factors were minor, and we lost negligible accuracy by having a generic model.
To break this down, the accuracy based on lane was:
- Top: 74.8%
- Mid: 75.5%
- Bottom: 78.9%
- Jungle: 78.8%
- None: 81.8%
Lane is automatically determined by Riot, so ‘None’ means the player moved around a lot and couldn’t be clearly defined in a lane.
Accuracy based on rank increased slightly as rank increased:
- Iron: 76.2%
- Bronze: 76.0%
- Silver: 77.7%
- Gold: 77.7%
- Platinum: 79.7%
- Diamond: 80.7%
- Grandmaster: 79.9%
- Challenger: 81.0%
As you can see, the variation in accuracy isn’t large. So, we stuck with a generic model as it allowed for a much simpler approach to quantifying performance.
For the Data Nerds
There is a lot of data sitting behind this model, so let's briefly touch on why we selected the model we did.
The first thing is the type of model. The machine learning method, Extreme Grading Boosting (XGB), provided the most accurate results with ~80% overall accuracy. However, it also introduced several questionable relationships in the model which did not make logical game sense. For this reason, the simplicity of the chosen linear regression model was preferred. It was easy to explain, made sense in all test scenarios, and was close to the accuracy of the XGB model.
Let's look at some accuracy stats of the model. The easiest to consider is the R squared value which explains the importance of the chosen variables in predicting the game outcome. A value closer to 1 means the variation in game stats explain the entire game outcome, while a value of 0 means they explain none. We will use the adjusted R squared values which accounts for the number of game statistics used, with the accuracy of winning or losing shown in brackets.
The chosen model described in this article: 0.317 (78.3%)
Adding creep score per minute: 0.317 (78.3%) which offered no improvement on the chosen model
Using only diamond ranked players to predict diamond grades: 0.356 (81.0%) compared with 80.7% accuracy for diamond players with the chosen model
Using only mid lane players to predict mid grades: 0.285 (75.5%) which is identical to the chosen model
Using only games of 15 or more minutes in length: 0.320 (78.0%)
As you can see from these examples, there is no noticeable improvement by adding variables (eg. creep score) or making the model more specific. Therefore, the simpler, generic model is the preferred approach.
Conclusion
After months spent looking at thousands of games of League, we feel this model is a good method to accurately quantify game performance. The above results support this, and it also holds up equally well for games ‘in the wild’. While it isn’t perfect, we do feel it offers a fairer grade than other third-party grading methods currently available. MaddCog is using this grading model in its apps that also monitor mental performance.
